journey of a sample
sample collection
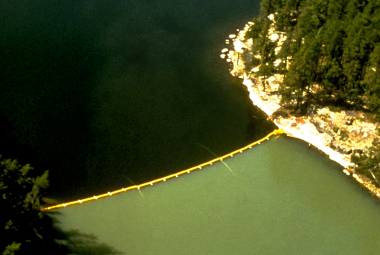
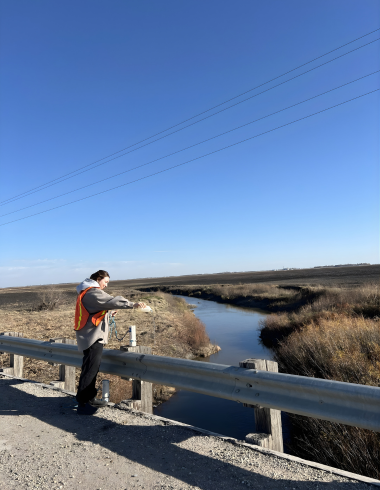
LWCBMN community volunteers collect samples frequently during the season to ensure we are capturing phosphorus runoff when it matters most. Whole water samples measure total phosphorus, consistent with provincial and federal monitoring programs. Filtered water samples measure dissolved phosphorus, the portion that’s readily available to feed algae. In preparation for the field season, LWF staff assemble and distribute thousands of sample packs! These are used by volunteers and watershed partners at over a hundred sites, from snowmelt until October.
lab analysis
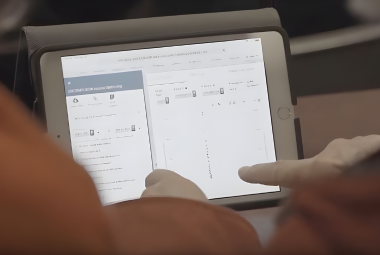
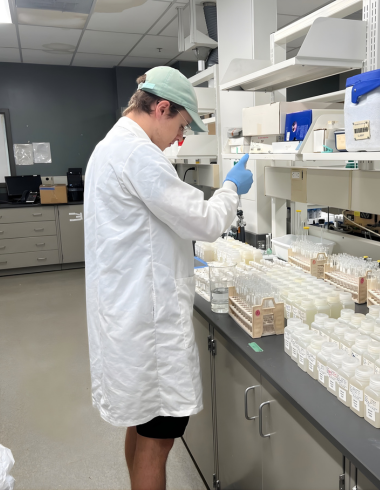
Collected LWCBMN samples are analyzed by our Water Data Specialist, Karl Friesen-Hughes, in Dr. Nora Casson's lab at the University of Winnipeg, using the same method as government water-monitoring programs. A chemical that reacts to the presence of phosphorus is added to samples, and the sample’s colour changes based on the concentration of phosphorus. A device called a spectrophotometer then measures light absorbance, enabling us to quantify phosphorus concentration. We engage in regular proficiency testing, analyzing standard samples sent to labs across the country to ensure our methods are credible and defensible. We regularly receive high marks from Proficiency Testing Canada.
data analysis
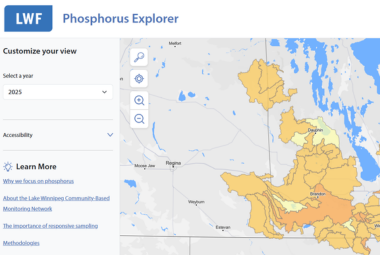
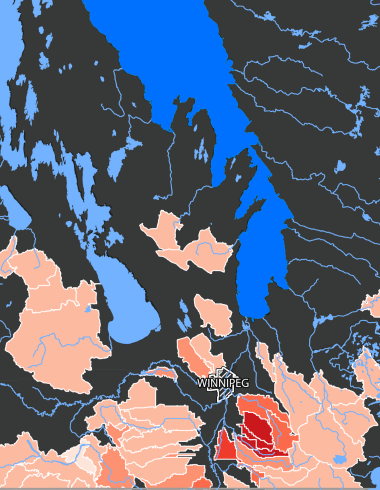
Phosphorus concentration from our lab analysis is combined with water-flow data from Water Survey of Canada (WSC) to calculate phosphorus load – the total amount of phosphorus flowing past a site in a field season. Using drainage area data from Water Survey of Canada, we also calculate phosphorus export – the amount of phosphorus exported from each hectare of land in each unique drainage area, expressed as kilograms per hectare per year. Phosphorus exports are then mapped to create colour-coded hotspot maps.
data sharing
Annually, our hotspot maps are uploaded to Phosphorus Explorer, an interactive online mapping platform, enabling community members and policymakers to compare hotspots across regions and years. We contextualize trends and insights from the data to share key lessons we are learning through our efforts. Phosphorus concentration data is also available at Lake Winnipeg DataStream.